Table of Contents
User and “Action” Buttons Section
Sorting of positions – other options
Displayed by Bookkeeping System Categorization
Displayed by In-House Classification
Intra-day and pending transaction section
Application Information Section
Client Holdings Views
This section provides information on functions that are common to both the portfolio and account views.
Note: In this chapter the words “portfolio” and “account” are interchangeable
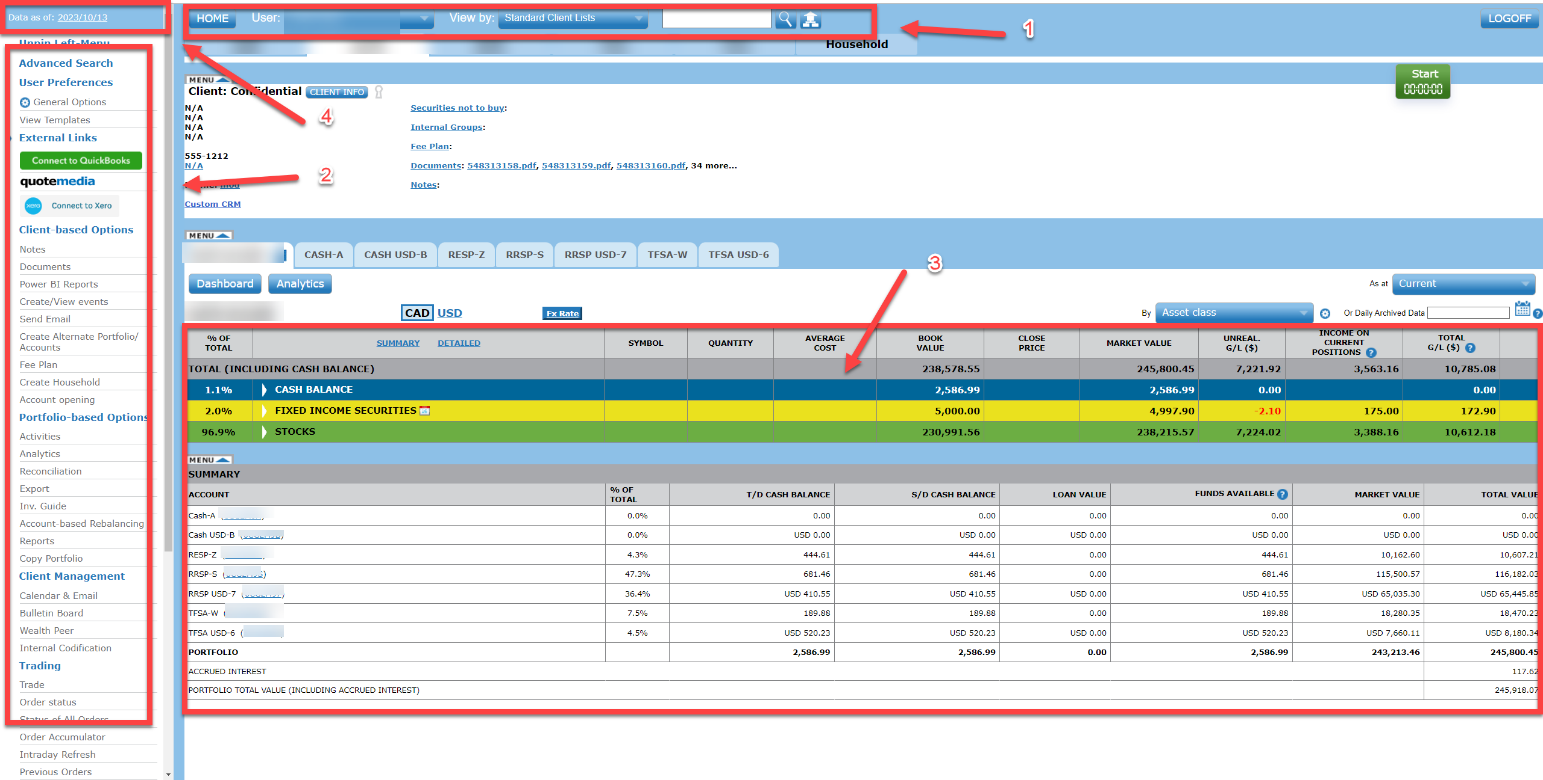
Holdings views workspace
The client Holdings view is divided into four (4) sections:
(1) Client Information section
(2) User and “Action” buttons section
(3) Client Holdings section
(4) Application Information section
The Client holdings section displays the financial information of the portfolio or account. The Application information section contains the last feed status update.
Client Information Section
The Client information section displays information and functions relating to the displayed client. They are:
 The home button brings the user back to the application home page
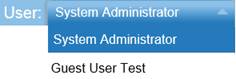
 User name hyperlink can be clicked to change users
Clicking on this arrow opens the “guest user’” dropdown to access another user setup:
 The search box is your quick access to clients’ files. You can search by account number, name or first name. If there is only one client matching your search, his portfolio will open automatically. If several clients match your search, you will be presented with a list of clients and will be able to access their portfolio by clicking on the appropriate name.

 Displays the client name. Clicking on the client name hyperlink opens the client information popup.
Displays the profile assigned to a client or determined by his Profile Questionnaire. By default, the acronym displayed is “Und.” (Undetermined) meaning that no profile has been set for this client.
View format  This function allows a user to toggle views between default view and holdings view.
 This function lets a user choose to display portfolio information in either Canadian or US currency. Select by clicking on the hyperlink
User and “Action” Buttons Section
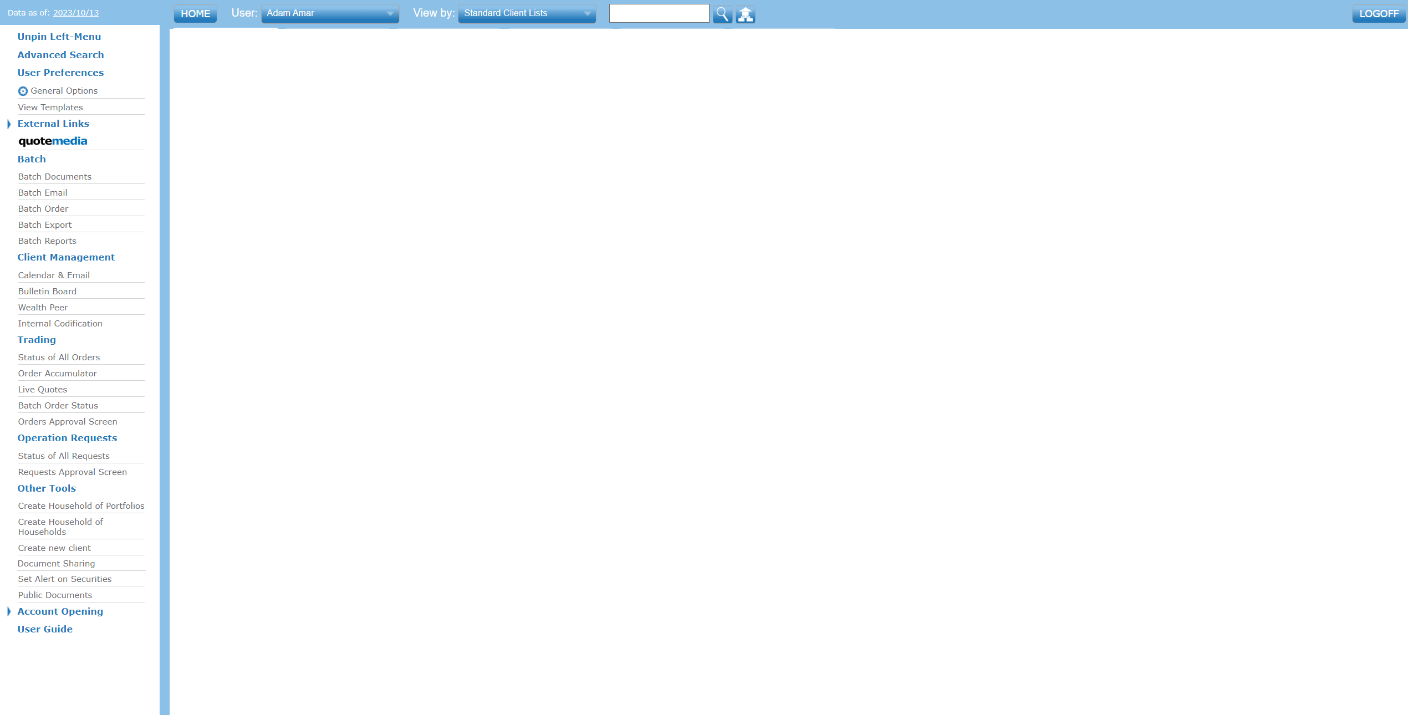
The User and “Action” buttons Section displays information and functions applicable to all clients. It is displayed wherever you are in the application and allows you to quickly access functions such as Client Search and Advanced Search.
|
|
Opens the client list management functions |
|
|
|
|
|
Allows you to reconfigure different settings. |
|
|
From holdings view templates, you can create new views depending on how you like to view your holdings page. |
|
|
This dropdown menu gives you access to batch documents, batch email, batch order, batch exports and batch reports. |
|
|
|
|
|
The calendar icon opens up your calendar and email where you can keep track of your clients’ important dates such as birthdays, fixed income maturities, options expiration, notes and appointments as well as meetings and reminders. Can email the client directly as well. |
|
|
Opens up a secure Intranet and Extranet that you can use to communicate and solicit replies with your clients and colleagues. |
|
|
Wealth Peer is your gateway to a great many investors and financial services providers. You can use Wealth Peer to advertise your products and management style. A sophisticated algorithm pairs you up anonymously with prospects based on their expressed criteria such as geographical location, assets to invest, product interest, and many more |
|
|
|
|
|
|
|
|
Allows you to retrieve all order statuses for all your clients. |
|
|
|
|
|
(For subscribers only) Gives you access to live markets quotes from PC Quote™ |
|
|
Allows you to view the status of all batch orders |
|
|
Opening this screen allows authorized supervisors to release trades of “junior” representatives. |
|
|
|
|
|
Allows you to track EFT and cheques transfer workflows for internal purposes. |
|
|
|
|
|
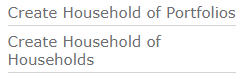
You can use these buttons to create a Households of Portfolios or a Household of Households. |
|
|
You can create off book clients and prospect clients to track down assets of positions not held with your institution or to prepare model portfolios for your prospects. |
|
|
Create users for the purpose of uploading and sharing documents via Ndex. |
|
|
You can set alert on securities so that a warning will trigger if there is a fluctuation in price beyond the price of alert. |
|
|
This hyperlink will be red if an alert has been triggered. |
|
|
|
|
|
|
|
|
Opens an account opening form. If a client already holds an account with your firm, you will be able to complete only the additional information required to open a different account type. For example, if your client already holds a cash account and wishes to open a margin account, you will only need to fill out the proper fields to trade on margin. All customers demographic, banking and other information is pre-filled from the original cash account opening. |
|
|
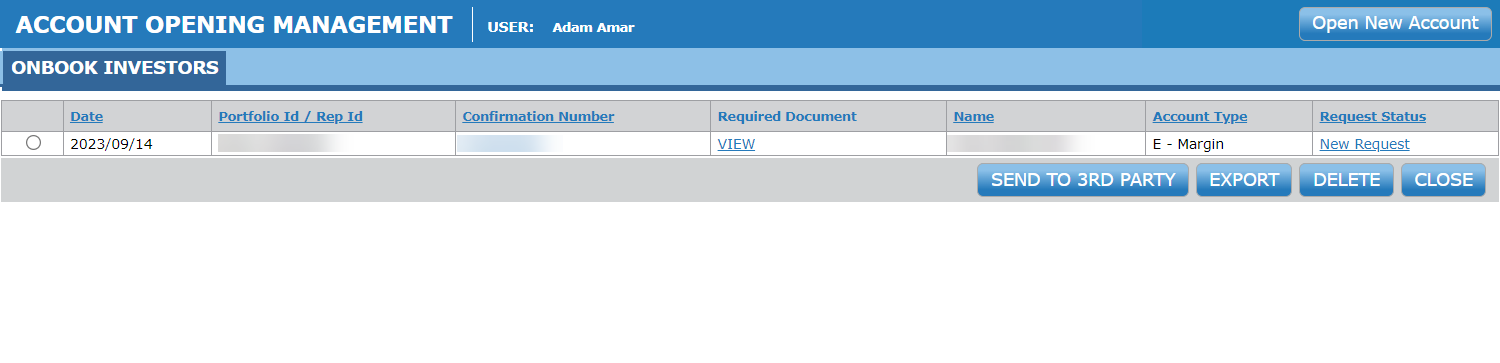
Allows you to track account opening workflows:
|


Client Holdings Section
The client holdings section is your complete overview of client holdings
Columns headers
Equals book value divided by number of units
 This value corresponds to the amount invested in the position, fees and commissions included.
 The close price corresponds to the security price at the last market close.
 Market value equals liquidation value of all assets.
 This column displays the total unrealized gains and losses, for all open positions. A positive figure indicates an unrealized gain while a negative figure indicates an unrealized loss. The percentage (%) represents the Unrealized Gain/Loss of the positions divided by the Book Value of the positions.
 The Income since Inception on a position is the income earned by this position since the opening transaction, no matter if the number of units has increased or decreased since then. If the position was closed and re-opened, the income is considered only since the last opening. This column displays income received since inception of the position, i.e. dividends, interest and distributions. The percentage (%) represents the Income of the position divided by the Book Value of the positions.
 The total gain/loss is the sum of income (dividends, interest, or distributions) received Please note that Total Gain/Loss definition is user configurable in the user's preferences. The actual definition is:
Unrealized Gain/Loss (since inception) + Income since inception
Note: Total Gain/loss definition can be adjusted in user preferences Totals row
The Totals row in the Holdings views shows a column Total Value.
Note: The Totals row can be set in the User Preferences to be displayed before the positions (at the top) or after the positions (at the bottom). It can also be set to include the Cash Balance or not. This latter choice applies only for the Book Value and the Market Value columns and is indicated between brackets in the row’s label
Asset Classes - Cash Balance
The Cash Balance component displays the cash balances available as of trade date. By default, the total cash balance is consolidated into Canadian dollars unless otherwise specified. It can be displayed at the beginning or the end of asset classes by adjusting your user preferences.

Other Asset Classes

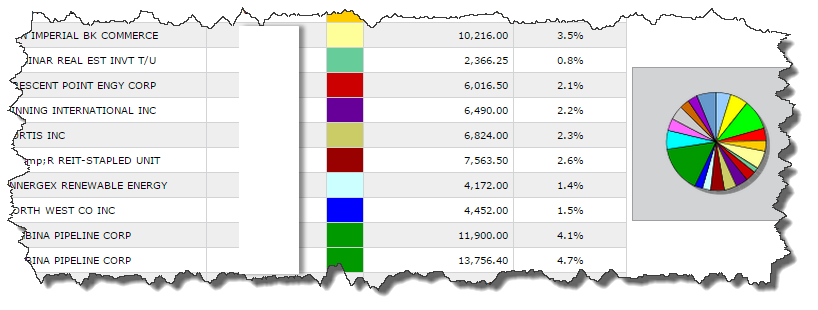
All other Asset Classes display position/class related information in a similar manner
 Class and subclass (when applicable)
 Portfolio Percentage of market value allocation to that class (and subclass if applicable)

As described in the column headers above
Positions detail

Though details may vary depending on the type of security (i.e. stock, option, fixed income, or mutual fund) the screen layout remains identical

The position description and account where security is held. Clicking on the position hyperlink opens a security detail window.
 Security symbol (CUSIP may be displayed for fixed income products). Click on description for code.
 Loan value of the position (for margin accounts only)
 Portfolio Percentage of market value allocation to that position
Alert setting – you can set a price or percentage alert for a position, which will be activated by the security close price.
Click on description hyperlink to access the price chart for the security held in position
Quantity The number of units held is context sensitive: Stocks are expressed in shares, fixed income in par value, and options in number of contracts

The average cost, book value, close price, market value, income since inception, unrealized gain/loss and total gain/loss are displayed on this line
 The book value field hyperlink gives access to the book value history for a position, where you can edit book values when applicable
=
Summary Section
The portfolio summary section recapitulates all financial details for the portfolio. If accounts are held in different currencies, each account financial information will be expressed in the currency of the account. The totals however, are converted to the currency of residence of the client. The exchange rate applied is posted daily on top of your portfolio screen in the holdings section as shown below:

Client “Action” Buttons
|
|
|
|
Allows the creation of a virtual portfolio for the client. |
|
|
|
Opens the Fee Management function. |
|
|
Allows you to open a new account. |
|
|
|
|
|
Retrieve and sort all client activities. |
|
|
These hyperlinks give access to the portfolio ROR and IRR. |
|
|
This pie chart gives you access to the portfolio asset allocation by asset class. You can drill down to open up a detail of the positions held for each of the asset classes:
|
|
|
Allows you to export client data in Excel format. |
|
|
Provides you with access to the client investment guide where you can see rebalancing instructions to bring the client portfolio back in line with his Investment Policy Statement. |
|
|
You can access all client reports with this button. |
|
|
This feature allows you to distribute assets amongst a client various accounts for optimal tax efficiency when rebalancing his portfolio. |
|
|
|
|
|
The calendar icon opens up your calendar and email where you can keep track of your clients’ important dates such as birthdays, fixed income maturities, options expiration, notes and appointments as well as meetings and reminders. Can email the client directly as well. |
|
|
Opens up a secure Intranet and Extranet that you can use to communicate and solicit replies with your clients and colleagues. |
|
|
Wealth Peer is your gateway to a great many investors and financial services providers. You can use Wealth Peer to advertise your products and management style. A sophisticated algorithm pairs you up anonymously with prospects based on their expressed criteria such as geographical location, assets to invest, product interest, and many more. |
|
|
|
|
Opens up the trading interface window where you can place orders electronically to be executed. |
|
|
|
Allows you to view the order status for the client you are currently viewing. |
|
|
Allows you to retrieve all order statuses for all your clients. |
|
|
Updates your client portfolio with current orders statuses as well as updated balances. |
|
|
Provides opens up a search box where you can look up previously executed transactions for a client. |
|
|
(For subscribers only) Gives you access to live markets quotes from PC Quote™ |
|
|
Gives you access to free delayed market quotes provided by PC Quote™ |
|
|
View the status of all batch orders. |
|
|
Allows authorized supervisors to release trades of “junior” representatives. |
|
|
|
|
|
Opens up the Operations request where you can submit client’s cheque and EFT transfers as well as transfers between accounts. |
|
|
Allows you to keep track of client’s cheque and EFT transfers as well as transfers between accounts. |
|
Allows you to view the operation requests status for the client. |
|
|
|
Allows you to track EFT and cheques transfer workflows for internal purposes. |


Positions in several accounts
When a position for the same security is held in several accounts, the consolidated position is displayed at the portfolio holdings view level as pictured below, and holdings details are displayed for each account as well.
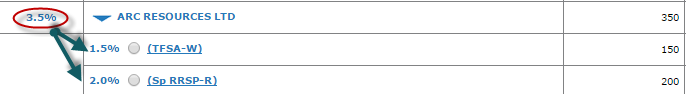
Interactive functions located at the account level of display are:
A radio button used to choose which position to trade
A hyperlink which opens the position details pop-up
A hyperlink for the edition of book value
An Alert icon
A historical price chart icon
Grouping of positions
By default, positions are displayed in alphabetical order, within their respective group. The order in which the groups are displayed depends on their grouping. It is possible to sort positions in other ways.
Sorting by column headers
You are able to sort in two different ways. The information will either be sorted in a summary or in a detailed version. Click on the blue underlined column header you wish to sort by.

Sorting by Currency
Amounts in a portfolio are always represented in a single currency unless otherwise indicated. You can choose to display all holdings in either Canadian or US dollars, using the hyperlink located on top of the portfolio page:
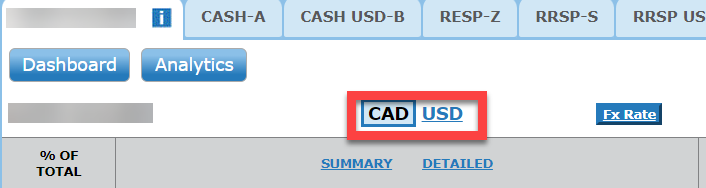
Note: Inter-Listed Securities are traded both in Canada and in United States, according to the bookkeeping system. Inter-listed securities are displayed in the currency of the account that they belong to. For instance, Barrick (ABX) will be displayed in US dollars if the account of reference is a USD account, whereas it will be displayed in Canadian dollars if the account of reference is a CAD account.
Sorting of positions – other options
Ndex allows the user to display the positions grouped in eight different ways in portfolio view and seven in account view:
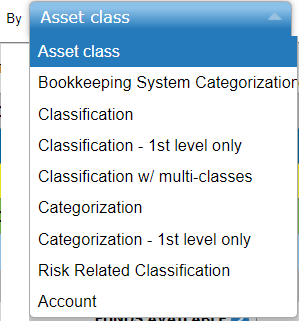
To change the way the positions are grouped, simply choose from the Displayed by dropdown.

The Cash Balance is always displayed in a separate section, regardless of the selected grouping.
Note: The default view can be set in the User Preferences page.
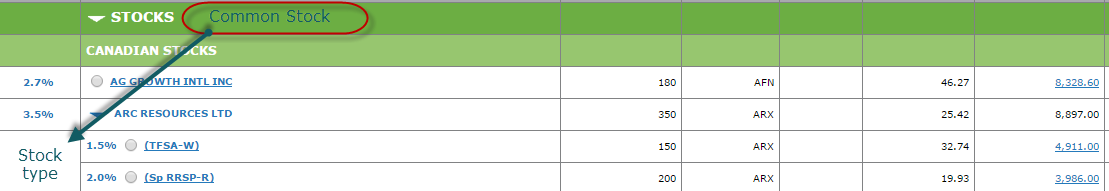
Displayed by Asset Class
The asset classes represent the four (4) groups of instrument generally referred to:
Stocks
Options
Fixed Income securities
Mutual Funds
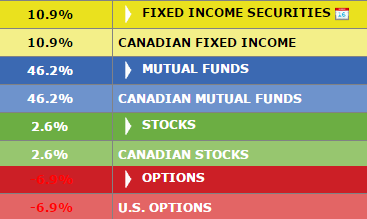
Note: An asset class for which the client holds no positions will not be displayed.
Each asset class is represented by its own color throughout the application for easy reference.
By default, the asset classes are displayed in alphabetical order.
Each asset class is subdivided in two (2) sub asset classes representing the currency of the positions: Canadian and US.
Example: client holding Canadian and US stocks will see the Canadian stocks grouped under the Canadian Stocks sub-section and the US stocks grouped under the US Stocks sub-section. These two sub-sections will be consolidated in the Stocks asset class.
The asset class row and the sub asset class rows display the sum of holdings grouped under it.
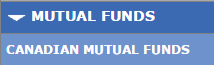
Displayed by Bookkeeping System Categorization
The Bookkeeping System Categorization refers to the categories, by asset class, as supplied by your firm’s bookkeeping system.
Here are some screen captures of supplied categories:
Options:
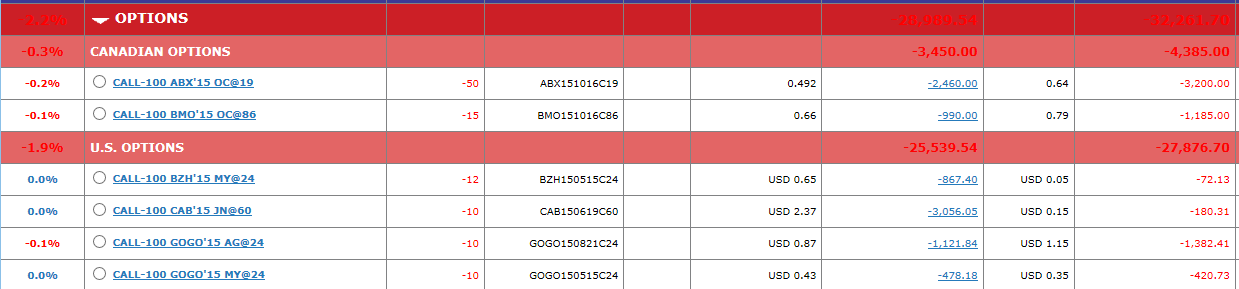
Fixed Income securities:
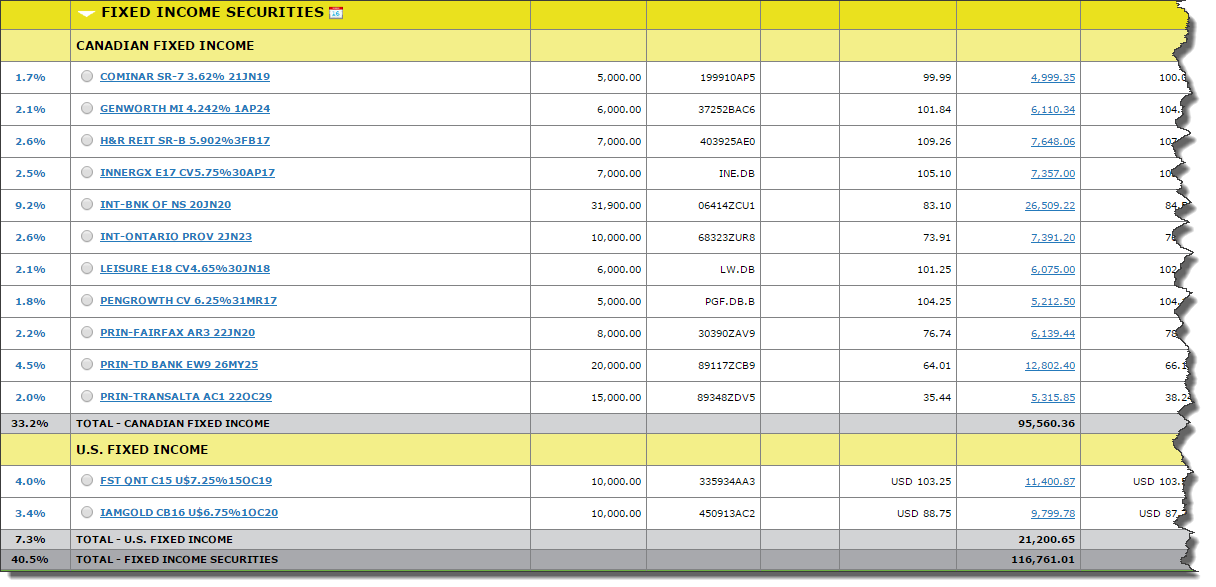
When displaying positions by Bookkeeping System Categorization, the positions are grouped independently of their currency.
However, the category rows always display the sum of the positions grouped under it in the firm’s main currency (Canadian).
Note: By default, categories are displayed in alphabetical order.
Displayed by In-House Classification
In-House Classification refers to the securities’ classification set in the back office module of Ndex’s system by your administrator. This type of classification is not limited to standard industry classes.
The securities are grouped under classes and sub-classes. The following example shows a customized in-house classification that includes stocks and fixed income. A firm can create as many classes and sub-classes as necessary to support its business model and preferences
Note: Classification is a firm wide choice. There can only be one in-house classification per firm
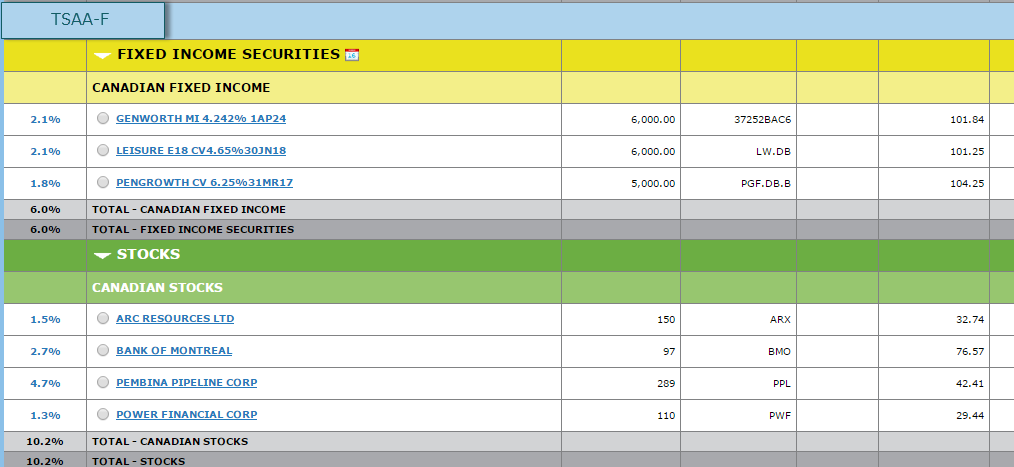
When displaying positions by In-House Classification, the positions can be grouped independently of their currency.
However, the classes and sub-classes rows always display the sum of the positions grouped under it in the firm’s main currency (Canadian).
By default, the classes are displayed in alphabetical order. The display sequence of the classes can be determined in the back office module by the administrator. If no sequence is determined, the default alphabetical order will apply.
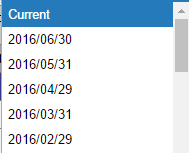
View As at 
This feature allows you to view backdate holdings. You can choose any month end.
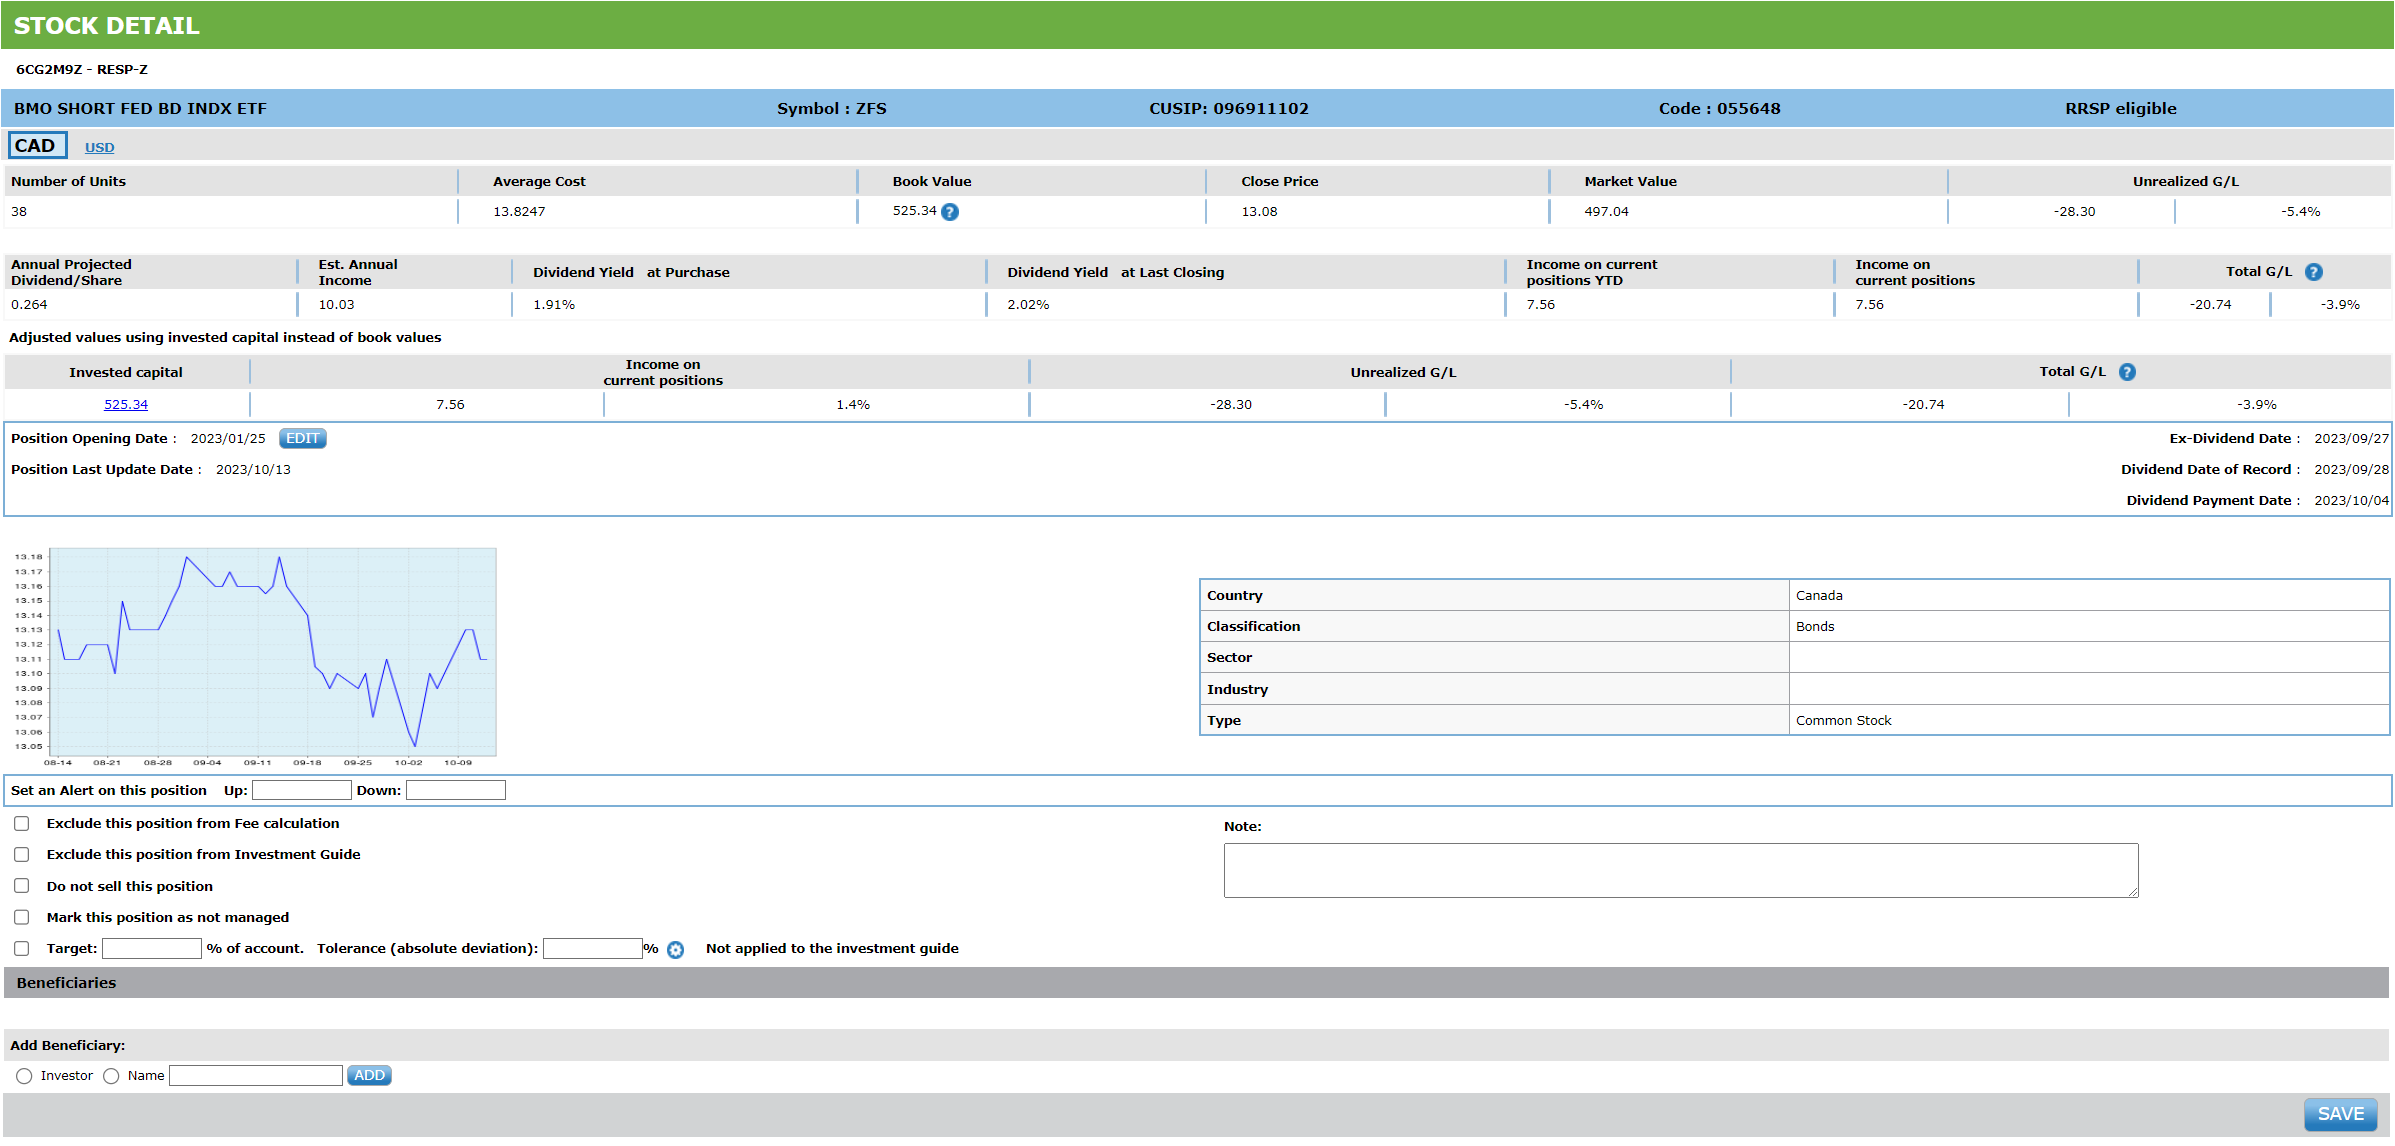
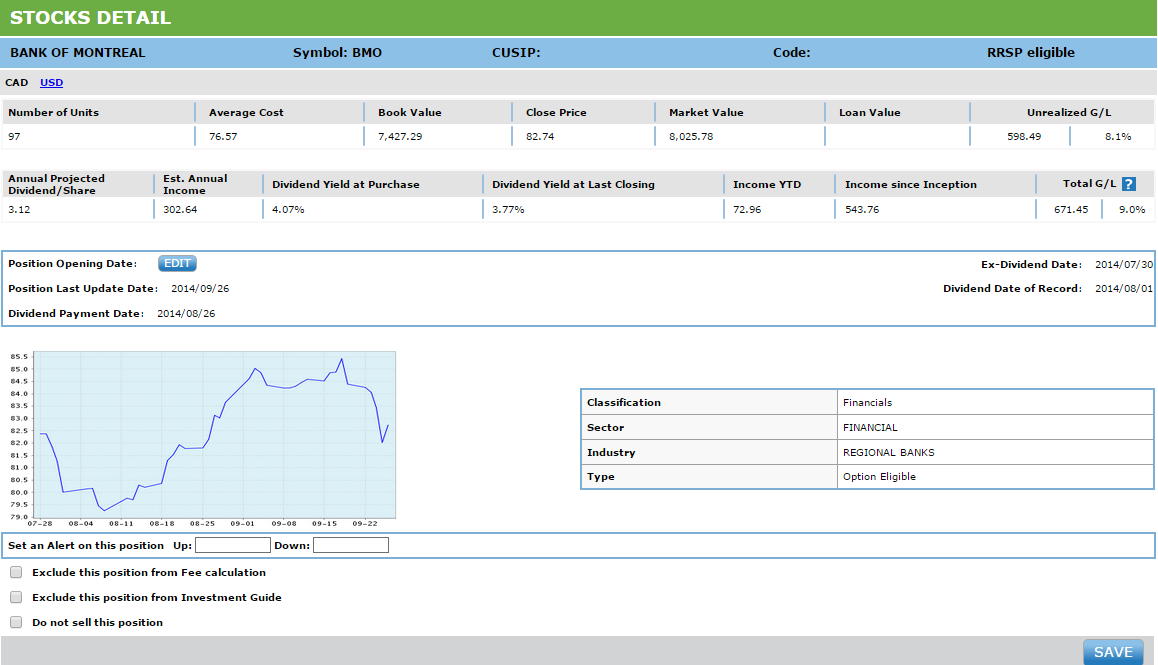
Viewing Security Details
You can access more details on a security by clicking on the Security description hyperlink. Please note that Security Detail is context sensitive. For instance, detail for an equity holding will include dividend information whereas a fixed Income holding will include yield related information.
Rate of Return page
Under portfolio-based options, you will find a choice of two hyperlinks : they open the Rate of Return pages:
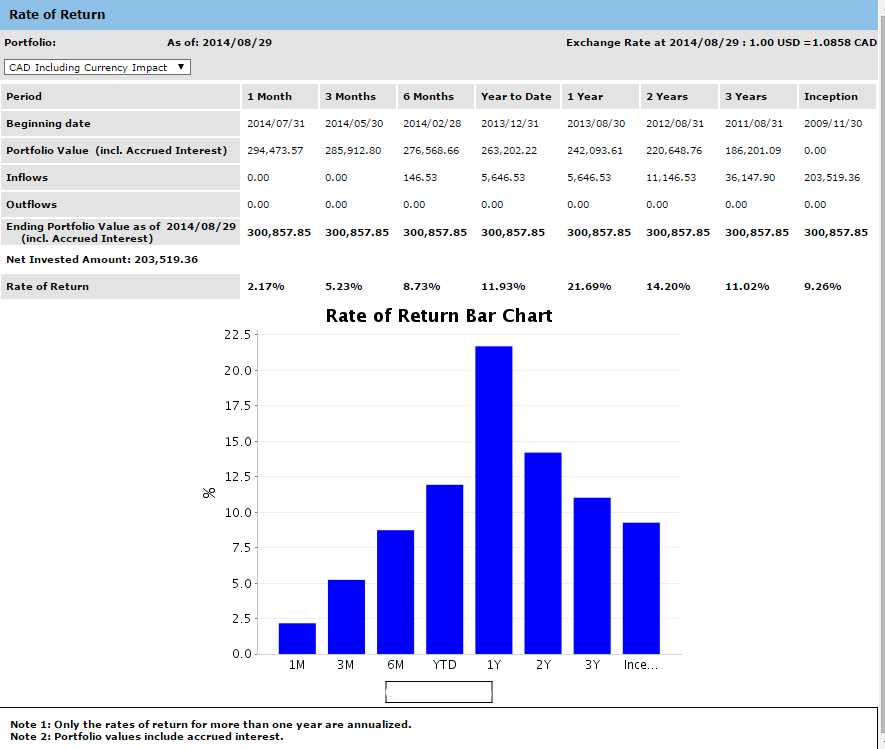
 : Using this dropdown, you may choose to display performance using the following choices:
In Canadian Dollars, including the Currency impact of USD holdings.
In Canadian Dollars, excluding the Currency impact of USD holdings
In USD, including the Currency impact of Canadian holdings
In USD, excluding the Currency impact of Canadian holdings
Rate of return period: Returns history is set by default. Many more options are available when creating reports (see Reports Chapter).
Rate of return: Please note that returns under one year cannot be annualized.
Rate of return bar chart and benchmarks: This chart visualizes historical returns for your client. It also displays benchmarks to compare performance against selected indices.
Note: Benchmarks must be set up and maintained by your administrator. Also, you must select which benchmark(s) you wish to use from your user preferences window.
Portfolio values include accrued interest: This is a role based property setup by your administrator. Including accrued interest in ROR computation will result in improved performance results.
Service fees considered as outflows for the calculation of the rate of return: This option is also role based and set up by your administrator. If you choose to treat service fees as outflows, service fees will not impact returns. Inversely, not treating those as outflows will result in their inclusion in performance computation, hence reducing performance results.
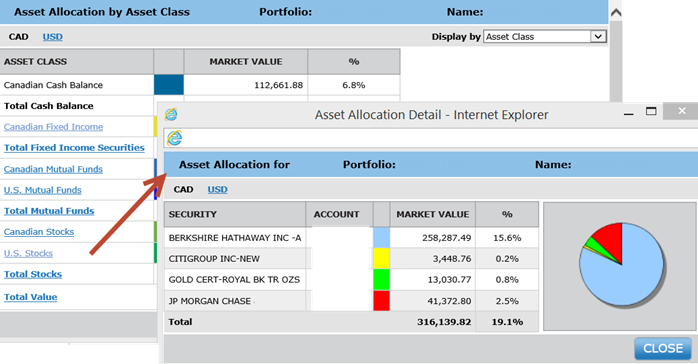
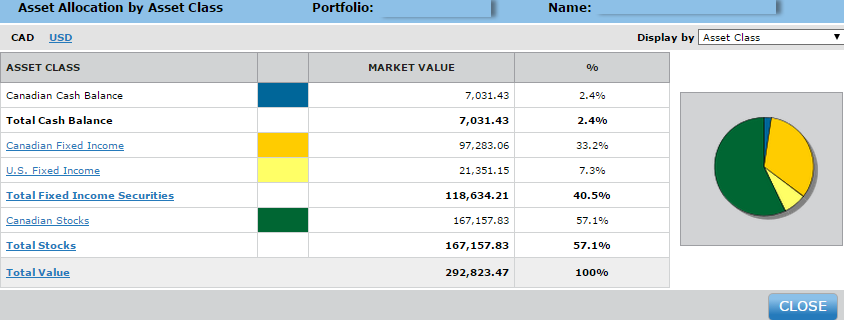
Asset Allocation pop-ups
Clicking on the Asst Allocation hyperlink opens the asset allocation pop-up for a graphic representation of asset allocation. By clicking on the hyperlink of each asset class, you get access to an asset allocation detail view for that asset class. You can open as many windows as you wish to visualize all classes of assets. Please note that you can display your assets either by asset class, in-house categorization, in-house classification, or by account (when in portfolio view) or by your bookkeeping system categorization.
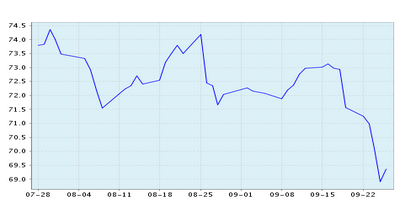
Price chart graph pop-up
The security hyperlink opens up a graph showing the price evolution of a security for the past two (2) months:
Intra-day and pending transaction section
When trading with Ndex, the application will display the status of your orders directly into the portfolio and account screens, along with the appropriate settlement day balance.

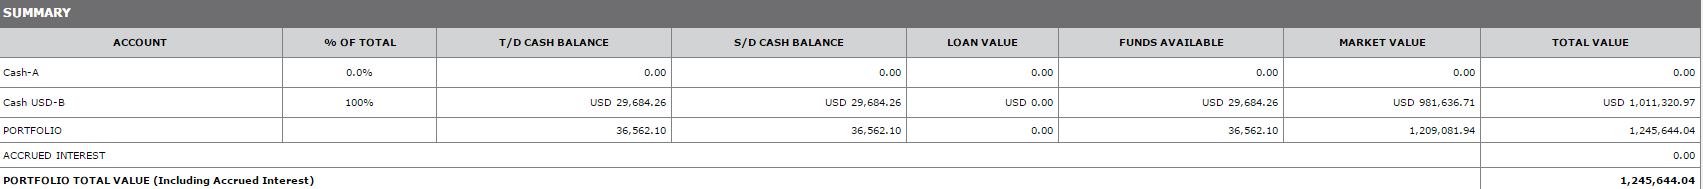
Summary section
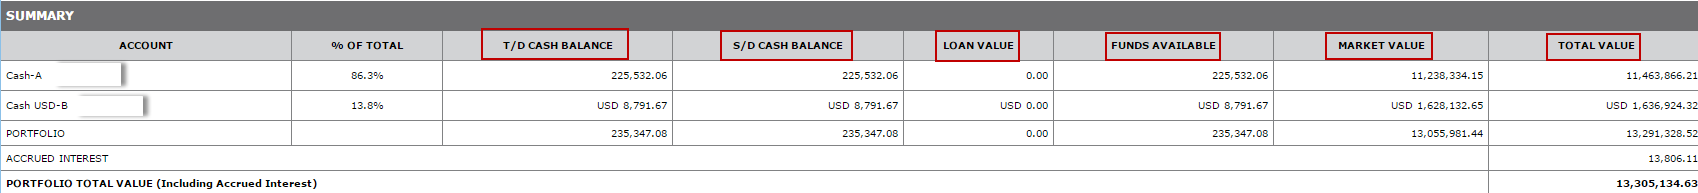
This section of the portfolio view displays the portfolio’s accounts balance and available margin in their currency and gives the total for the portfolio in the firm’s currency.
T/D (Trade Date) Cash Balance: This amount is the portfolio cash balance considering that all the pending transactions have been settled.
S/D (Settlement Date) Cash Balance: This amount is the portfolio cash balance before the settlement of all pending transactions.
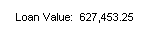
Loan Value: The loan value corresponds to the amount a client may borrow against its equity to invest.
Note: Loan Value is only applicable to clients who own margin accounts
Funds Available: The available margin is the sum of the trade date cash balance and the loan value. When the client is subject to a margin call, the displayed amount is negative.
Market Value: The Market Value is the sum of the market value of each account held in a portfolio. It is obtained by adding the market value of each position of each account, which is calculated as follows: number of units held * unit market price.
Note: The market value is calculated at trade date, i.e. as if all the pending transactions have been settled.
Total Value: The Total Value is the Market Value plus the T/D Cash Balance.
Accrued Interest section

Accrued Interest: Displays the total of all the interest accrued on the positions held in the portfolio. Applies only to Fixed Income positions
Portfolio Total Value (including Accrued Interest) = Market value + Cash Balance + Accrued Interest.
Application Information Section
This section contains important information regarding your application
Last feed date. This information is critical as it indicates the date of the latest data upload and therefore lets you know whether your data is up to date.